2015 is shattering severe weather inactivity records. From 1 January to 31 March, only eight severe weather watches have been issued nationwide (3 TOR watches in Jan., 1 in Feb.; 4 SVR watches in Mar, pending the chance for severe weather across portions of OK and TX today EDIT 4-1-2015: 6 more SVR watches were issued on 31 March, bringing the Mar total to 10 SVR watches and the yearly total to 14). Of course, if you ask the residents of Sand Springs or Moore, OK, why this year has been so inactive, you might get a few nasty remarks. Last week (25th Mar.), an EF2 tornado killed one person in a mobile home park outside of Sand Springs, while another EF2 tornado swept through the town of Moore. This marks the 5th tornado in the city limits since 1998 and should remind us that it only takes one event to change the perspective of an entire severe weather season for a local community.
However, from a climatological, i.e., accounting, perspective, this season has been oddly calm. As an example, let's take a look at the number of 2015 tornadoes reported in the U.S. v. the 10-yr average:
 |
| 2015 accumulated preliminary tornado reports (red line) and the 2005-2014 average (black line). Image courtesy of Greg Carbin (Storm Prediction Center). |
On average, one would expect ~222 tornadoes to occur in the U.S. by March 31st. Our current tally of 37 puts the U.S. just over 16% of normal for this date. In addition (as the red bars indicate), a majority of the tornado activity this year has fallen on only 3 calendar days.
From a scientific perspective, it begs the question, "Why?"
Dissecting this question involves the understanding of atmospheric ingredients that are necessary for the formation of tornado producing thunderstorms. In short, weather conditions that typically cause severe thunderstorms have been in short order so far in 2015 (as I stated in a recent interview to Live Science). Below is an image of the Jan-Mar 2015 lifted index anomaly values vs. 30-yr Jan-Mar normals. Lifted index provides a quick and easy calculation of whether or not the atmosphere is conducive to thunderstorm activity (positive values indicate stable weather conditions, and thus an atmosphere unfavorable for thunderstorms).
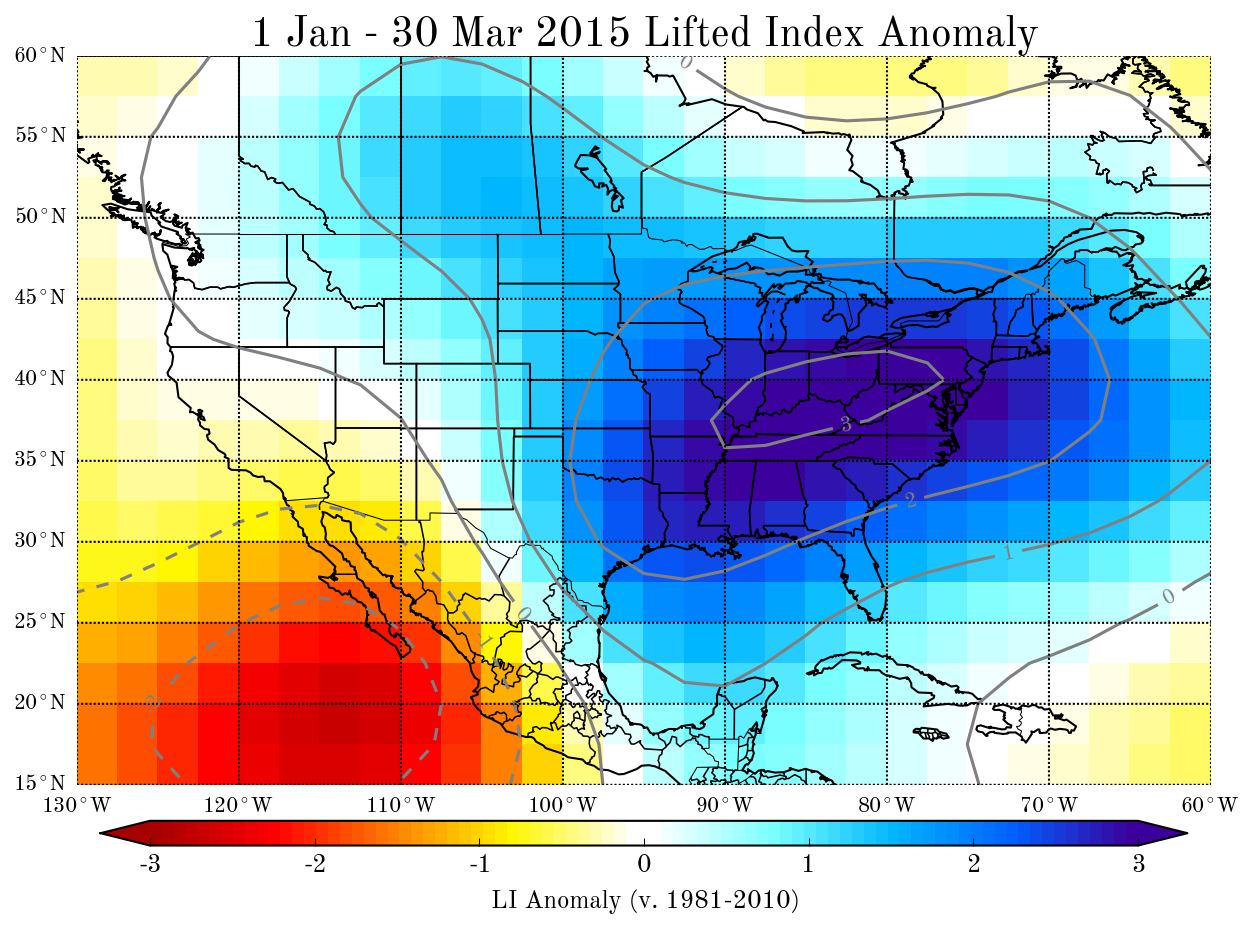 |
| Data provided by NOAA's ESRL PSD; maps by author |
My subjective interpretation of such a stable and non-conducive atmosphere for thunderstorms this year is related to the positive sea surface temperature anomalies in the Eastern Pacific Ocean:
 |
| Data courtesy of NOAA's ESRL PSD; annotations are my own |
This anomalously warm water has been responsible for driving a semi-permanent area of ridging into the Gulf of Alaska (very similar to the conditions throughout most of the winter months in 2014). This amplified jet in the Eastern Pacific has forced downstream troughing over the eastern two thirds of North America, helping to drive the cold temperatures found throughout the winter in places like Chicago, Boston, and New York City. There is also additional recent research from colleagues that suggest our current declared state of ENSO is unfavorable for tornado activity across the U.S. (something that has been speculated for many years).
Speaking of ENSO, I'd like to turn the discussion to extended range prediction of U.S. severe weather activity. By extended range, I am referring to the sub-seasonal to seasonal time scales (2 weeks to 3 months). I recently met in Washington D.C. with colleagues from around the country interested in this topic, where we shared ideas and methodologies pertinent to such an effort. Current "official" severe weather forecasts in the U.S. are not issued beyond one week because the time and spatial scales associated with tornadoes make it extremely difficult to forecast beyond a couple of days (let alone 2+ weeks!). Our goal is not to predict the exact timing and locations of tornadoes like the well-known Storm Prediction Center (SPC) convective outlooks. Instead, we are interested in predicting U.S. severe weather activity levels (defined by various metrics) at subseasonal to seasonal time scales. Using new techniques, there is evidence that this can be a skillful endeavor (I will refrain from going in depth with such techniques at this time). As an example, I provided a sub-seasonal forecast for tornado activity on March 8th, 2015 on my personal Twitter account (@gensiniwx):

Indeed (or as luck would have it!?), no tornado watches were issued in March 2015, a successful 23 day sub-seasonal forecast. It is important to verify these sub-seasonal forecasts (right or wrong), else there is no way to learn from the good/bad forecasts that will ultimately happen. I am planning on setting up a webpage that will house such forecasts and associated verification, so please be patient as this is a slowly developing process with many interested parties.
You may be curious to know what my forecast looks like for April 2015. I provided a 20+ day forecast on my Twitter account on 17 March 2015, that calls for an uptick in severe weather during the 6-16 April period (always give or take a few days when dealing with forecasts at these time scales). I am slightly worried that a mid-month lull in activity could take place, producing some uncertainty in mid-late April forecast.

Overall, I think April 2015 will finish average to above average in terms of severe weather activity (counts/watches/etc.) across the U.S. My confidence/probability breakdown for this forecast is as follows:

Overall, I think April 2015 will finish average to above average in terms of severe weather activity (counts/watches/etc.) across the U.S. My confidence/probability breakdown for this forecast is as follows:
20% Chance Below Average | 40% Chance Average | 40% Chance Above Average
Look for a verification post when April 2015 concludes.